
As product managers, we often feel like we’re piloting a ship through complex waters. We have a destination in mind – a successful product – but without clear instruments, it’s hard to know if we’re on course, if the engine is running smoothly, or if the passengers (our users) are happy.
Decoding User Behavior: Building a Comprehensive Product Metrics Framework
This is where a comprehensive product metrics framework comes in. It’s not just about collecting data; it’s about structuring that data to gain meaningful insights into user behavior, measure performance, and make data-informed decisions that drive your product forward. Think of it like a doctor monitoring vital signs; they use a structured set of metrics (heart rate, blood pressure, temperature) to understand a patient’s overall health and identify specific areas needing attention. Similarly, a product metrics framework provides a structured way to understand your product’s health and identify areas for improvement.
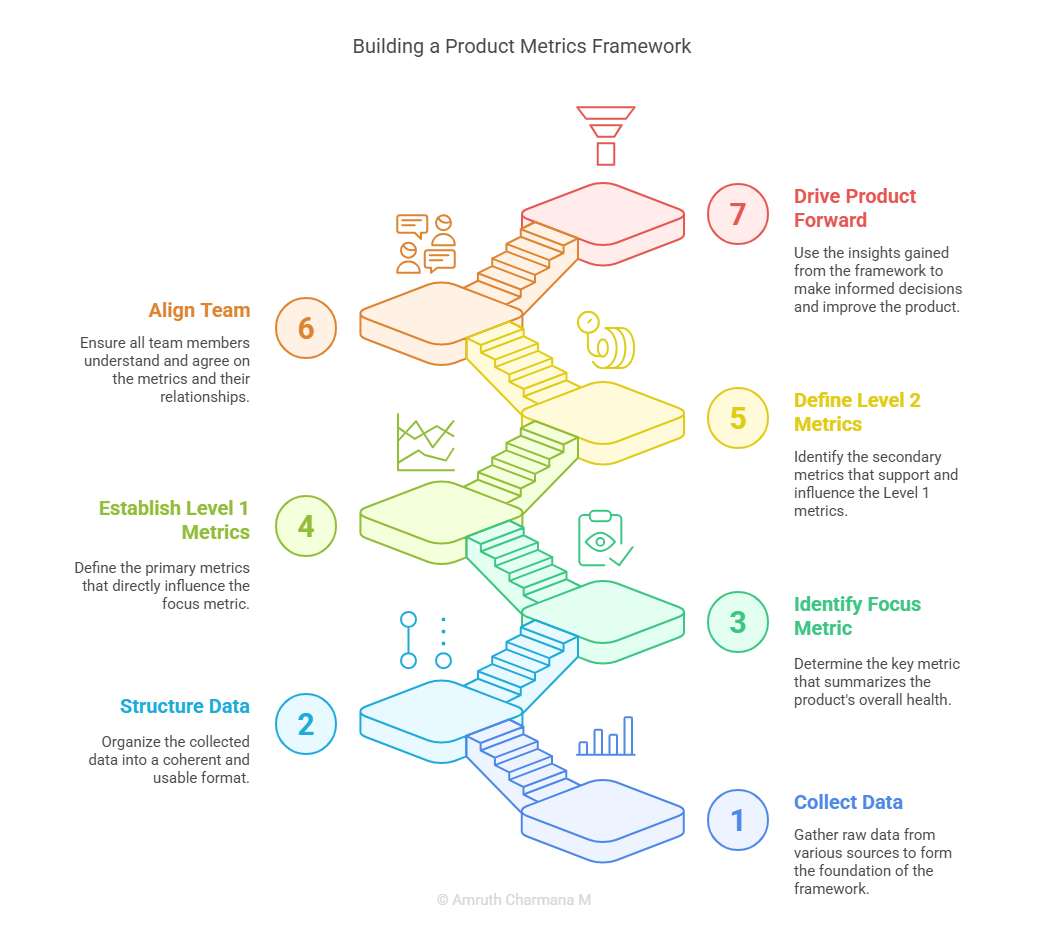
Building an effective framework helps you organize and prioritize the various metrics you track. It typically features a focus metric that gives a high-level summary of the product’s overall health. This focus metric is then supported by more granular Level 1 and Level 2 metrics that influence the focus metric. This hierarchy clarifies the relationships between different metrics and helps align your team on what to measure and improve.
Let’s explore some crucial categories of product metrics you’ll want to include in your framework:
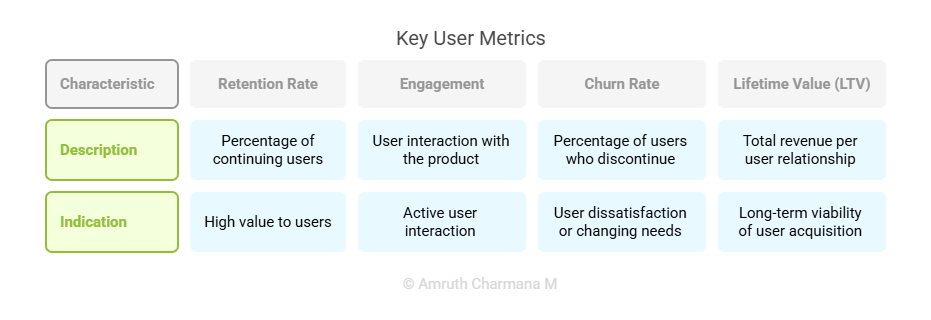
User Metrics:
These metrics provide insights into how much users value your product and its long-term sustainability.
- Retention Rate: The percentage of users who continue using the product over time. High retention indicates users find ongoing value.
- Engagement: How actively users interact with the product. This can be measured by frequency of visits, time spent, or specific actions taken within the product.
- Churn Rate: The percentage of users who stop using the product. This is the flip side of retention and a key indicator of user dissatisfaction or changing needs.
- Lifetime Value (LTV): The total revenue a user is expected to generate over their entire relationship with your product. This is crucial for understanding the long-term viability of your user acquisition efforts.
Observe this: Tracking these metrics is like measuring the loyalty of customers to a store. Are they coming back? How often? Are they spending more over time? Are they leaving for a competitor?
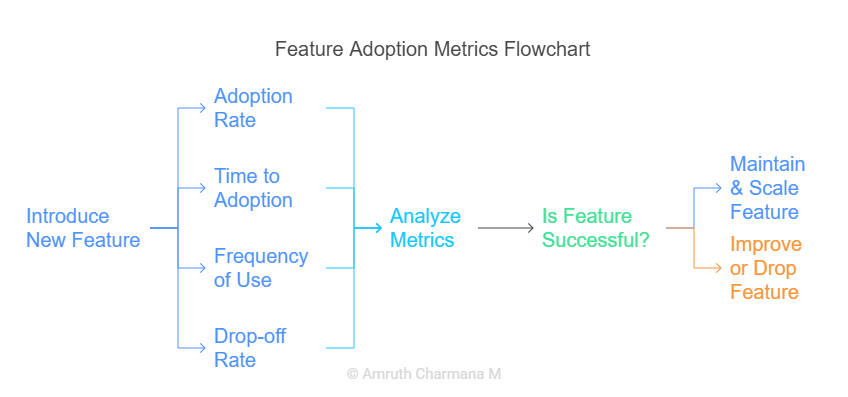
Feature Adoption Metrics:
These metrics tell you if and how users are utilizing specific features.
- Adoption Rate: The percentage of users who use a particular feature.
- Time to Adoption: How quickly users start using a new feature after it’s introduced.
- Frequency of Use: How often users engage with a feature.
- Drop-off Rate: The percentage of users who stop using a feature after trying it.
Observe this: Monitoring these metrics is like tracking the popularity of new menu items at a restaurant. Are customers trying them? Are they ordering them again? Which ones are a hit, and which ones aren’t landing?
Here is a good source to explore on this topic by Astha Rattan. Click here for source link.
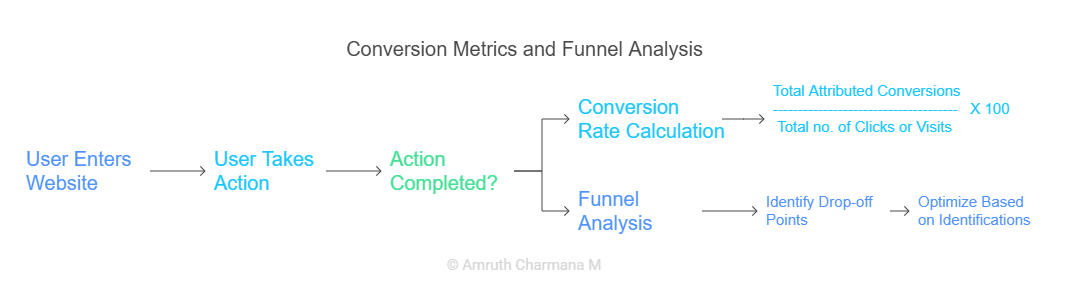
Conversion Metrics:
These measure the percentage of users who complete a desired action.
- Conversion Rate: The percentage of users who complete a specific goal, such as signing up, making a purchase, or upgrading their account.
- Funnel Analysis: Tracking user progression through a series of steps towards a conversion goal to identify where users drop off.
Observe this: Analyzing conversion metrics and funnels is like tracking customers through a checkout process in a physical store. Where are they pausing? Where are they leaving their carts? This helps identify bottlenecks.
Operational Metrics:
These focus on the technical performance and reliability of the product.
- Uptime: The percentage of time the product is available and functioning.
- Performance: Speed and responsiveness of the product.
- Reliability: Stability and absence of errors or crashes.
Observe this: Keeping an eye on operational metrics is like ensuring a car runs smoothly. Is the engine sputtering? Are the brakes working? These metrics are crucial for a positive user experience, as technical issues can quickly lead to user frustration and churn.
Other Techniques:
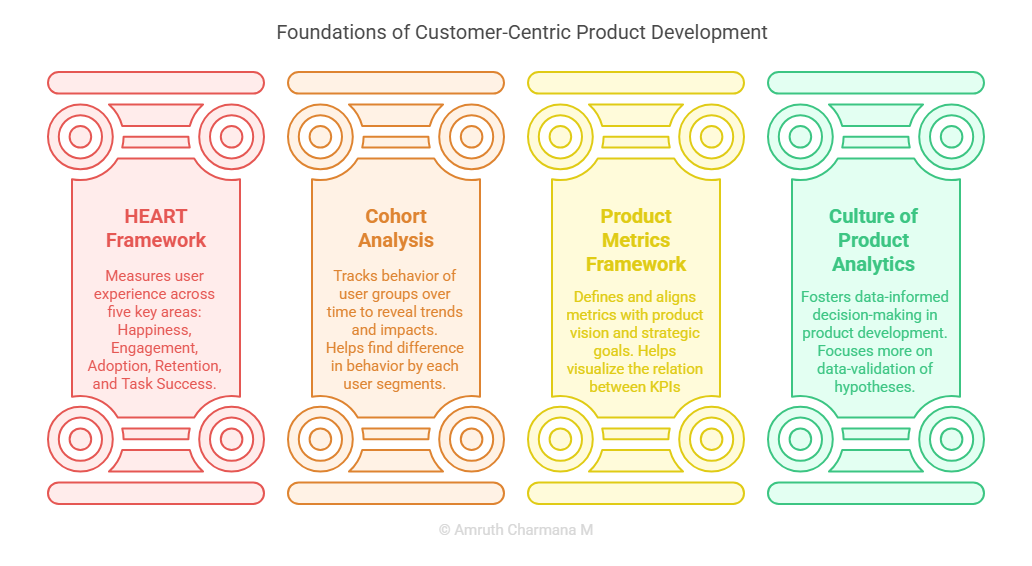
Beyond these core categories, frameworks like the HEART Framework by Google offer a more holistic approach to measuring user experience across five key areas: Happiness, Engagement, Adoption, Retention, and Task Success. This is like measuring customer satisfaction with a service, looking at their feelings, how often they return, if they try new offerings, if they stick around, and if they can actually accomplish what they came to do.
Another powerful technique is Cohort Analysis. This involves tracking the behavior of specific groups of users (cohorts) who share a common characteristic, such as the month they signed up, over time. Like studying different age groups in a population, cohort analysis can reveal trends in user retention, highlight the long-term impact of product changes, and show differences in behavior between different user segments.
Building a robust product metrics framework requires thoughtful design. You need to define which metrics are most important (your focus metric and supporting levels), understand how they relate to each other (sometimes visualized with KPI trees), and ensure they align with your overall product vision and strategic goals. Just like a company’s financial report uses a hierarchy of key indicators supported by detailed figures, your metrics framework should provide clarity and focus.
Ultimately, the goal is to foster a culture of product analytics where decisions are data-informed. Like a scientist conducting experiments, product managers should use data to validate hypotheses and guide product development.
My two cents:
What if your metrics framework could predict future user behavior? Imagine a system that could analyze current trends and user patterns to forecast potential churn risks, identify features likely to gain traction, or even anticipate unarticulated user needs. While still largely in the realm of advanced data science and machine learning, focusing on building a comprehensive, well-structured framework today is the essential first step toward unlocking such predictive power tomorrow. Could leveraging AI and machine learning revolutionize how we understand and utilize product data?
Building and continuously refining your product metrics framework is a fundamental practice for any product manager aiming to truly understand their users and guide their product toward sustained success.
It’s your dashboard, your vital signs monitor, and your compass all rolled into one, ensuring you’re not building in the dark.